

If you’ve been following this blog, you might be a bit frustrated with me right now. I mean, reading each post no doubt took some time. Some of you followed because you know and care about my kids. Others are part of the dyslexia tribe and can relate to “all the feels.” If you made it through them all, you probably think I’ve short-changed your time investment. It’s like reading almost an entire novel and realizing the last chapter has been torn out. Huh? An entire story without a conclusion. The season finale of a story that ends with a cliffhanger….
Okay, okay….I’m giving myself a little too much credit. I don’t believe this blog stirs up quite that much emotion and I sincerely doubt anyone is eagerly anticipating my next post. But I do feel like I have more to say, and more to prove. It all comes down to results. You can talk a big game about how great a program is and how much you are progressing, but the proof is in the pudding. When we left The Morris Center I wanted nothing more than to post all my kids’ before and after results for the world to see. It would somehow feel validating to prove to others that we had made the right choice to go to TMC. The numbers speak for themselves and there’s no denying the growth. Showing those reports would give hope to so many, yet cause others some speculation (back to the “too-good-to-be-true” mentality). But at the end of the day, I decided it wasn’t my place to post the specifics. This progress didn’t belong to me. It belongs to my children. So out of respect for them, I decided to not share all the detailed data. It’s part of their story and it’s up to them to decide if and when they want to share it.
With that said, I don’t think it’s right to keep people in the dark completely. Especially if my purpose is to continue raising awareness and promoting the programs at TMC. The easiest and most succinct way to see their growth is through the bar graphs below (I’m purposefully omitting the standard score numbers for their privacy….excuse the terrible phone pictures):
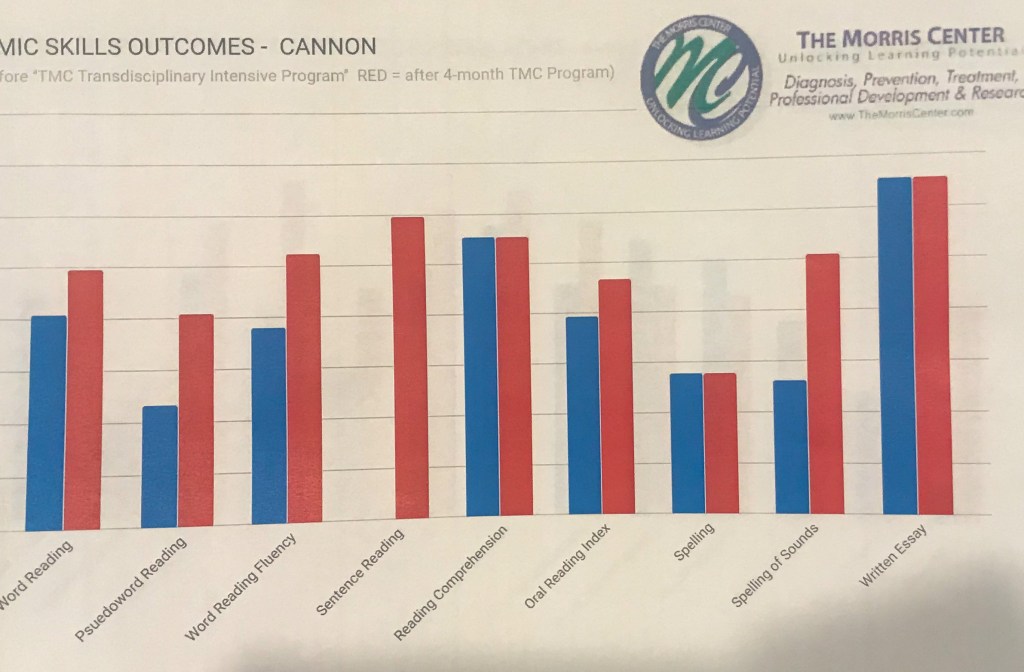

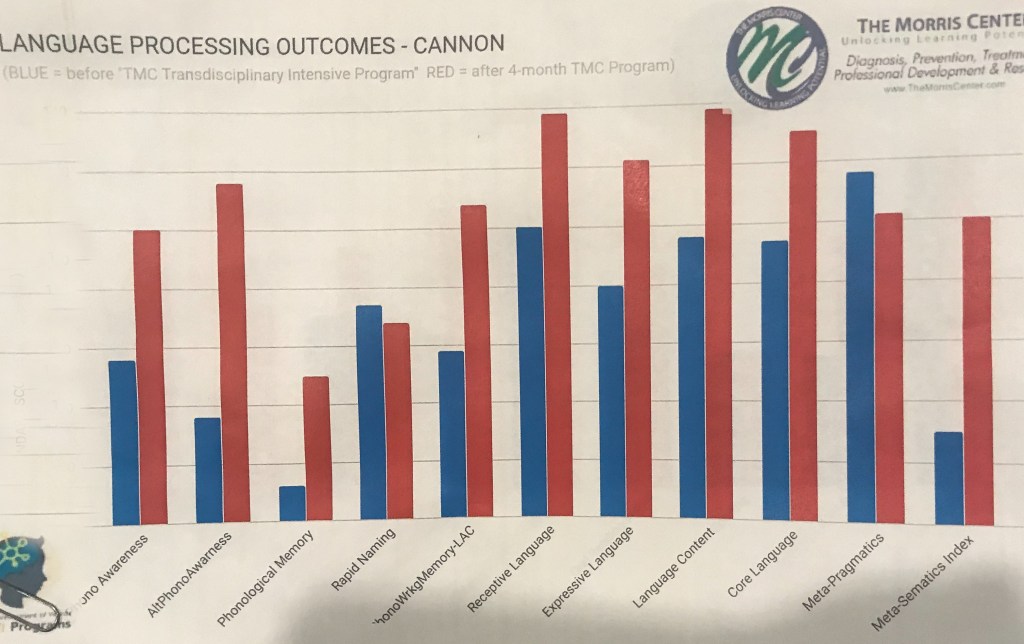
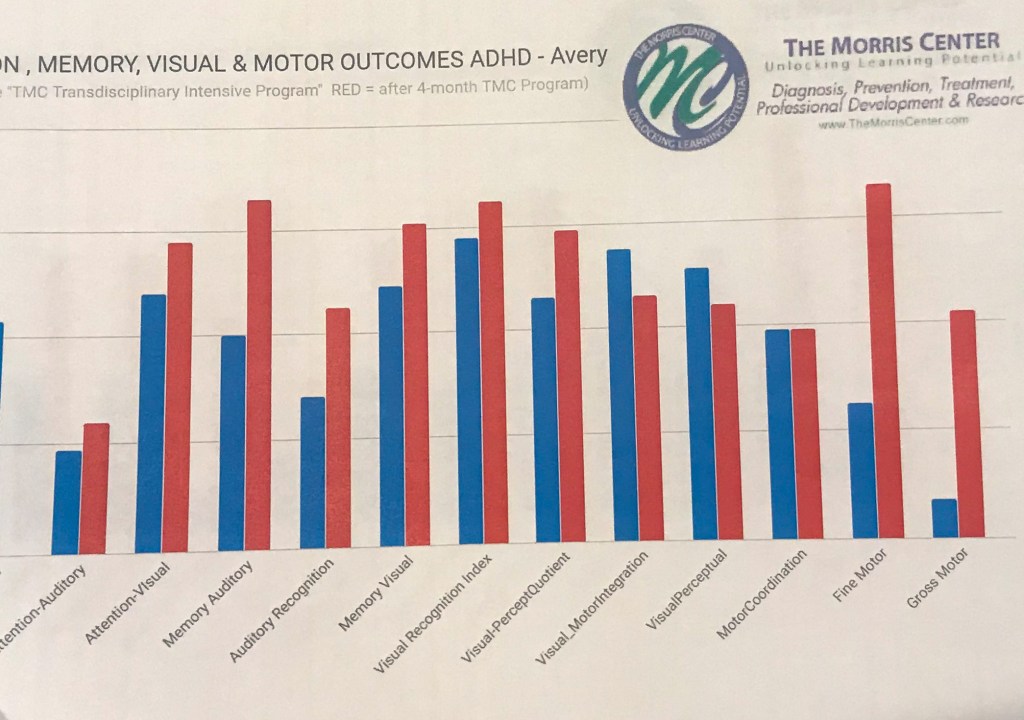


For all you “statistic/number people,” the results speak for themselves. These bar graphs are certainly important. But as a mom, I’m not hanging my hat on these results alone. You can analyze testing and use it as a measurement for success all you want. But at the end of the day, there’s one thing that is more telling than test scores could ever be. In fact, I believe it’s the best indicator for what a difference TMC has made for my kids. In the bottom of my daughter’s backpack (where I once found shredded pieces of schoolwork she wanted to hide), I found a drawing she did one day while at school. Look closely and you will see through her eyes just how much this program has changed her now and for the future. This is all the proof I need:
(Side note: my aunt, who is a retired art teacher gasped when she saw this drawing. She said not many kids could draw from this perspective….from the back, looking forward…with the backs of people’s heads. I have to think the Mental Imagery part of TMC program played a big part in helping her visualize this way).

